


Project management is undoubtedly a tough job that involves motivating employees to do work for you, keeping track of all activities, making sure you meet deadlines, delivering top quality work, all while making sure your employees are happy and satisfied.
Although this role seems an infliction in the modern world, project management hasn’t changed much since the turn of the twentieth century. Without the array of sophisticated tools at our disposal, project managers were expected to slog it out during these trying times. One such project manager took it upon himself to invent a tool of his own, which eventually went on to become the go-to tool for all managers thereafter. Henry Gantt, the founder of the eponymous Gantt chart, may very well have been the first project manager, and a genius at that too.
Early beginnings
Gantt was born into a prosperous family in Maryland in 1861. After completing his education in mechanical engineering from Stevens Institute of Technology (also the alma mater of his mentor, Frederick Taylor), Gantt later joined the Midvale Steel Company. Here he met Frederick Taylor, the father of principal of scientific management. Taylor’s methods of using science to improve efficiency and increase production had a lasting impression on Gantt. Two of his most famous inventions – the Task and Bonus system and the Gantt chart, were both based on the same principal and proved to be path-breaking in the industrial world.
Gantt’s task and bonus wage system
Though Gantt was a protégé of Taylor, they disagreed on the wage and bonus system in place at that time. Taylor believed in paying slightly higher wages to few carefully selected workers in return for performing substantially higher work. According to him, a monetary incentive was the only criteria for a worker to work harder, and paying a little more would boost morale enough to get work done. As observed from his famous excerpt about a fellow worker named Schmidt, this system managed to produce desirable results. However, Taylor penalized underperforming workers, which created a hostile working atmosphere between the underperformers and high-performers.
In contrast, Gantt opined that every worker should have an equal chance of earning higher wages, and refrained from imposing any penalties on low-performing workers. Instead, Gantt devised a task and bonus system, where workers finishing the standard task assigned for the day received a bonus on top of their daily wages. Additionally, underperforming workers were not penalized and they still received their daily wage, irrespective of the work they had completed that day. Through such a mechanism, Gantt often saw production doubled compared to previous days. More importantly, by ensuring each worker’s minimum wage remained intact, he lifted the morale of every worker who strived to earn more.
Gantt further improvised the current task and bonus system by offering a higher wage rate if a worker exceeded expectations for the day. This further incentivized the workers to perform at a higher rate to earn more. In conclusion, low-performing and top workers benefitted the most from the system. However, the workers who just managed finish their tasks fell short of earning an extra bonus and were paid at the same rate as the lowest performing workers, thus missing out on the extra income.
The story of the Gantt chart
Gantt invented the eponymous chart when working with a cotton mill in 1908. Gantt was recruited to increase the efficiency of labor at the mill and subsequently, he spent weeks just studying their style of working. Upon implementing his task and bonus system, Gantt also made use of a horizontal bar chart to track the progress for the day of every worker. If the standard task for the day was achieved, he could colour the bar black to denote bonus earned, else it would be colored red. Gantt’s ultimate purpose was to shift all workers in the mill – the skilled and unskilled – from the red group to the black group. The below chart gives the complete picture of the result of his efforts.

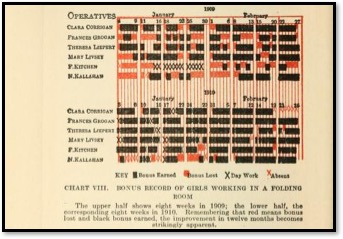
Later, while contributing towards war effort in Frankford Arsenal on government commission, he improvised his earlier developed Gantt chart. His role involved tracking tasks of multiple government departments on a strict timeline. Struck by the complexity, Gantt made use of his bar chart to plot the tasks based on the time taken, and not on quantity covered. The resulting representation showed for the first time the sequence of tasks assigned and helped estimate an expected date when the project would be complete.
Understanding the Gantt Chart for modern-day usage
The Gantt chart proves to be useful for managing any complex project which requires a number of tasks to be completed. The chart is used to keep a tab on the progress of several tasks and also estimate a deadline for project completion.

The initial and foremost step is to ascertain all tasks and activities required to be completed to finish a project. It also involves leaving room for any project delays and pre-deciding fallback options in case of any contingency. This helps avoid any mid-project hassle commonly associated with lengthy and tedious projects.
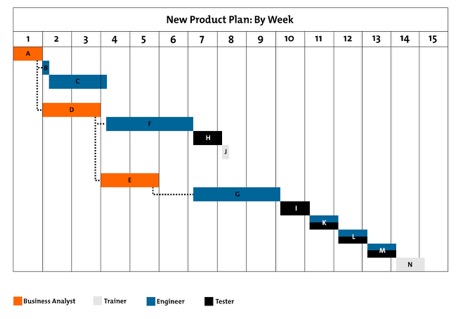
Once all tasks have been identified, the next step is to decide on a suitable timeframe to complete each task. Many tasks are interrelated, and some can be started only after another gets completed. For example, a data analyst would first need the correct data before they start preparing an analysis. Hence, data analysis can follow only once the data entry has been completed. Many tasks can also run parallel to each other, such as designing a book cover and preparing a manuscript. Only once both tasks have been completed can we send the book for editing before publishing it.
The task schedules are visually represented using a bar chart, where each bar depicts a single task. The chart plots time on the horizontal axis, and the different tasks on the vertical axis. The length of each bar depicts the expected time duration required to fulfill a certain task. The bars can also be color-coded to identify the personnel responsible for finishing a certain task.
Impact of Gantt in today’s time
Although the chart was invented almost a century ago, it remains a very popular project management tool. Many software suites such as Microsoft Project, Celoxis, Smartsheet among others can convert suitable data into a Gantt chart.
Gantt’s task and bonus system also remain popular in the corporate world. Many companies follow Gantt’s system and offer annual bonuses, with high-performers earning a substantially higher amount compared to the rest. Moving a step further from the carrot and stick method to a system based on incentives, Gantt has impacted the lives of millions of workers now earning high wages and even higher bonuses.